Evidence of Understanding
- use mean, median, and mode to aggregate and interpret univariate data
- describe what is gained and lost by interpreting a data set using the mean, median, or mode
- describe how frequency and range impacts mean, median, and mode
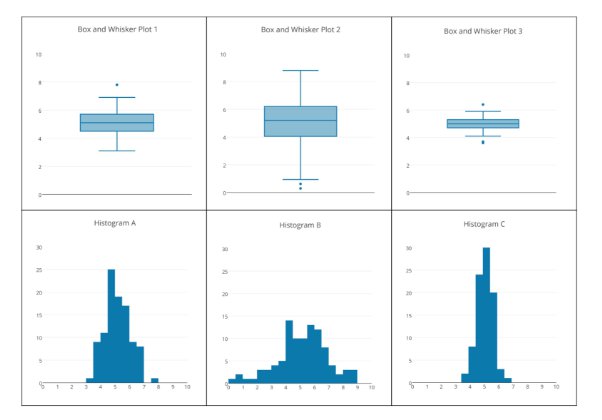
- Interpret statistical representations such as box plots, dot pots, histograms, bar graphs, tables, etc. where some data points occur with a frequency > 1
- describe how removing or adding a value to a data set impacts the mean and median
- explain the effect of an extreme outlier on the mean compared to its effect on the median
- identify which value(s) can be added to the data set that do not alter the median, mean, or mode and justify why
- use range and density to describe how individual data points relate to the mean
- use range and density of points towards the center to describe the variability of a data set
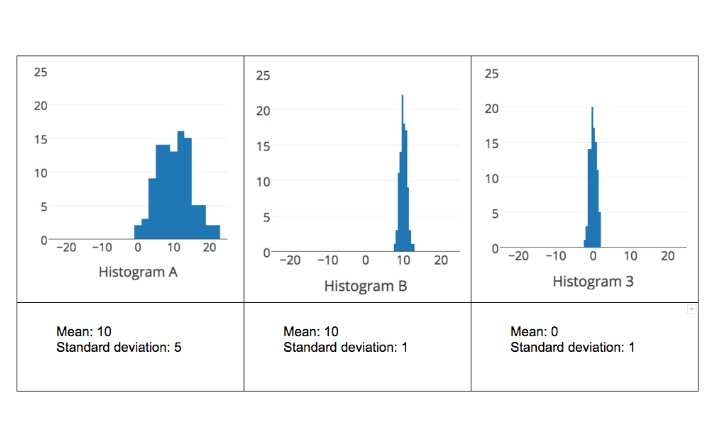
- use standard deviation to describe how range and variation are related to the mean
- use a data set’s distribution to consider and justify where other data points may lie in relation to the mean
- interpret the spread and mean of a statistical distribution.
- interpret and describe connections between the frequency and distribution across different representations (graphs, tables, or charts)
- Determine the extent to which the difference matters
- Articulate the relationship between a normal distribution (a result of a continuous random variable) and a binomial distribution (a result of a discrete random variable).
- Compare the experimental and theoretical probability of a sample space using areas in the distribution curve
Develop conceptual understanding:
statistics, univariate, measures of center, mean, median, mode, frequency, range, outlier, density, variability, standard deviation, distribution, spread, normal distribution, binomial distributionSupporting terms to communicate:
data point, data set, independent, dependent, domain, range, random, sample, categorized, summarized, discrete, continuous
