- NV Math Team
- Getting Started
- Algebra I Archive
- 1: Curriculum Components
- 2: Instructional Routines
- 2A: Contemplate then Calculate
- 2B: Connecting Representations
- 2C: Group Learning Routines
- 2D: Additional Instructional Routines
- 3: ELL and SpEd Student Support
- A1 U0: Introduction to Algebra I
- A1 U1: Modeling with Functions
- A1 U2: Linear and Exponential Functions
- A1 U3: Linear Equations and Inequalities in One Variable
- A1 U4: Linear Equations and Inequalities in Two Variables
- A1 U5: Quadratic Functions
- A1 U6: Quadratic Equations
- A1 U7: Statistics
- Geometry & Algebra II Archive
- Geo U0: Introduction to Geometry
- Geo U1: Tools of Geometry
- Geo U2: Proofs about Congruence
- Geo U3: Similarity and Proof
- Geo U4: Right Triangle Trigonometry
- Geo U5: Extending to Three Dimensions
- Geo U6: Coordinate Geometry
- Geo U6: Circles
- A2 U0: Introduction to Algebra II
- A2 U1: Families of Functions
- A2 U2: Exponential Functions
- A2 U3: Trigonometric Functions
- A2 U4: Rational and Polynomial Functions
- A2 U5: Probability
- A2 U6: Statistics (Inferences from Data)
- Regents Readiness
- Find Resources
Find Resources
Search and browse resources for your classroom.
Use the filters below to see resources for a specific course, unit, and more.
Curriculum:
Filter By:
Type
Standards
- Common Core: Major Standards
- Common Core: Supporting Standards
- Common Core: Additional Standards
- Common Core: Practice Standards
Showing 16 Resources:
Clear Filters
Analyzing Graphs

Resource:
Analyzing Graphs
4 different equations of functions each representing from a different function family. All functions represented in the same graph. Students play with calculators inputting values to see which correspond to the appropriate function in the graph.

Teacher Feedback
Please comment below with questions, feedback, suggestions, or descriptions of your experience using this resource with students.
All Resources From:
As the wheel turns

Resource:
As the wheel turns
This Illustrative Mathematics task assesses if students can construct a trigonometric model that represents a context.

Teacher Feedback
Please comment below with questions, feedback, suggestions, or descriptions of your experience using this resource with students.
All Resources From:
Building a quadratic function from f(x)=x²

Resource:
Building a quadratic function from f(x)=x²
Students sketch the parent function and then sketch different transformations of that function to compare them.

Teacher Feedback
Please comment below with questions, feedback, suggestions, or descriptions of your experience using this resource with students.
All Resources From:
Carbon 14 dating in practice

Resource:
Carbon 14 dating in practice
This task focuses on using Carbon 14 isotope exponential decay to date when plant died. If plant died at a certain time, how much Carbon 14 should still be present?

Teacher Feedback
Please comment below with questions, feedback, suggestions, or descriptions of your experience using this resource with students.
All Resources From:
Choosing an Appropriate Growth Model

Resource:
Choosing an Appropriate Growth Model
A table comparing the populations of three different cities every 10 years. Students figure out which family of functions best models each city.

Teacher Feedback
Please comment below with questions, feedback, suggestions, or descriptions of your experience using this resource with students.
All Resources From:
Comparing Graphs of Functions

Resource:
Comparing Graphs of Functions
Students use equations, graphs, and tables to compare linear, exponential, and quadratic functions. As students compare the functions they should use rate of change and end behavior to help differentiate the function families and their unique properties. Meant to be supported with some kind of graphing technology whether graphing calculators, Desmos, Geogebra, or some other similar tools.
Teacher Feedback
Please comment below with questions, feedback, suggestions, or descriptions of your experience using this resource with students.
All Resources From:
Comparing Graphs of Functions #2

Resource:
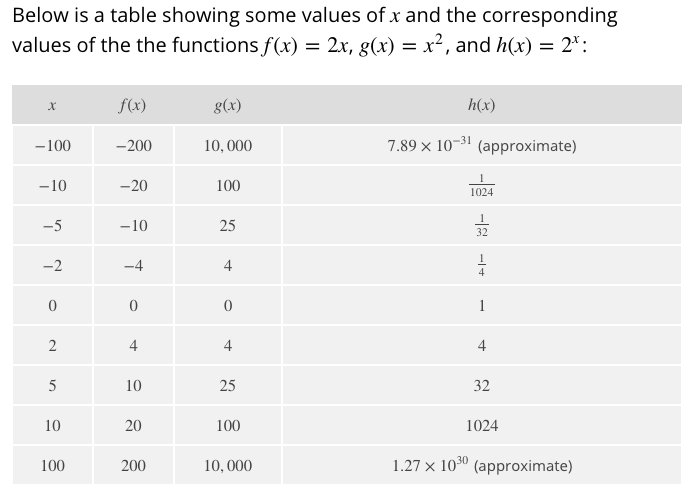
Comparing Graphs of Functions #2
Students compare three functions: f(x)=2x, g(x)=x2 and h(x)=2x and analyze rates of change. It would be good to modify the activity by having students also graph and create tables for the three functions then describe how they compare in each of those representations.

Teacher Feedback
Please comment below with questions, feedback, suggestions, or descriptions of your experience using this resource with students.
All Resources From:
Finding rate of change from graphs

Resource:
Finding rate of change from graphs
These four questions can help you surface how students understand finding rate of change from a set of graphs.

Teacher Feedback
Please comment below with questions, feedback, suggestions, or descriptions of your experience using this resource with students.
All Resources From:
Foxes and Rabbits

Resource:
Foxes and Rabbits
This Illustrative Mathematics task asks students to construct a pair of related trigonometric models to solve a contextual problem.

Teacher Feedback
Please comment below with questions, feedback, suggestions, or descriptions of your experience using this resource with students.
All Resources From:
Geology Rocks

Resource:
Geology Rocks
-

Teacher Feedback
Please comment below with questions, feedback, suggestions, or descriptions of your experience using this resource with students.
Hoisting the Flag 1

Resource:
Hoisting the Flag 1
Students are given a situation about a flag being raised and several graphs. They have to explain why each graph might work and what is going on to model the situation.

Teacher Feedback
Please comment below with questions, feedback, suggestions, or descriptions of your experience using this resource with students.
All Resources From:
Moore's Law and Computers

Resource:
Moore's Law and Computers
Students are given Moore's prediction for how quickly memory storage would grow for computers and then given data for different years on average PC storage capacity. Students need to see how their function based on Moore's predictions compares to real life data and continually refine based on subsequent years. Teachers might want to encourage students to also create graphs and tables with this activity.

Teacher Feedback
Please comment below with questions, feedback, suggestions, or descriptions of your experience using this resource with students.
All Resources From: