- NV Math Team
- Getting Started
- Algebra I Archive
- 1: Curriculum Components
- 2: Instructional Routines
- 2A: Contemplate then Calculate
- 2B: Connecting Representations
- 2C: Group Learning Routines
- 2D: Additional Instructional Routines
- 3: ELL and SpEd Student Support
- A1 U0: Introduction to Algebra I
- A1 U1: Modeling with Functions
- A1 U2: Linear and Exponential Functions
- A1 U3: Linear Equations and Inequalities in One Variable
- A1 U4: Linear Equations and Inequalities in Two Variables
- A1 U5: Quadratic Functions
- A1 U6: Quadratic Equations
- A1 U7: Statistics
- Geometry & Algebra II Archive
- Geo U0: Introduction to Geometry
- Geo U1: Tools of Geometry
- Geo U2: Proofs about Congruence
- Geo U3: Similarity and Proof
- Geo U4: Right Triangle Trigonometry
- Geo U5: Extending to Three Dimensions
- Geo U6: Coordinate Geometry
- Geo U6: Circles
- A2 U0: Introduction to Algebra II
- A2 U1: Families of Functions
- A2 U2: Exponential Functions
- A2 U3: Trigonometric Functions
- A2 U4: Rational and Polynomial Functions
- A2 U5: Probability
- A2 U6: Statistics (Inferences from Data)
- Regents Readiness
- Find Resources
Find Resources
Search and browse resources for your classroom.
Use the filters below to see resources for a specific course, unit, and more.
Curriculum:
Filter By:
Type
Standards
- Common Core: Major Standards
- Common Core: Supporting Standards
- Common Core: Additional Standards
- Common Core: Practice Standards
Showing 15 Resources:
Clear Filters
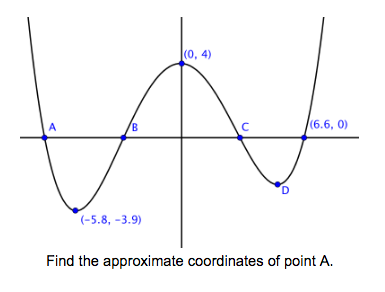
Approximate the Zero

Resource:
Approximate the Zero
Chunk a graph to use the relationships between distances on a graph to estimate the value of a zero of the graph.
Teacher Feedback
Please comment below with questions, feedback, suggestions, or descriptions of your experience using this resource with students.
All Resources From:
Characteristics of Quadratics

Resource:
Characteristics of Quadratics
Students analyze different representations of quadratic functions to determine what characteristics of quadratic functions are true for every quadratic function, and then extend their understanding to analyze polynomial functions.

Teacher Feedback
Please comment below with questions, feedback, suggestions, or descriptions of your experience using this resource with students.
Distance vs Time Graphs

Resource:
Distance vs Time Graphs
Students will use situations to interpret graphs representing the situations.

Teacher Feedback
Please comment below with questions, feedback, suggestions, or descriptions of your experience using this resource with students.
All Resources From:
Factored Equations and Polynomial Graphs

Resource:
Factored Equations and Polynomial Graphs
Students will connect factors of polynomial equations with the intercepts of their corresponding graph.

Teacher Feedback
Please comment below with questions, feedback, suggestions, or descriptions of your experience using this resource with students.
Function Transformations
Resource:
Function Transformations
Students learn how to transform parent functions into other functions using transformations.
Teacher Feedback
Please comment below with questions, feedback, suggestions, or descriptions of your experience using this resource with students.
All Resources From:
Graphing Stories

Resource:
Graphing Stories
10 videos each with a situation that students model by sketching a graph.

Teacher Feedback
Please comment below with questions, feedback, suggestions, or descriptions of your experience using this resource with students.
All Resources From:
Graphs and Descriptions of Parabolas

Resource:
Graphs and Descriptions of Parabolas
Students will connect a graph of a parabola with a written description of its axis and number of roots.

Teacher Feedback
Please comment below with questions, feedback, suggestions, or descriptions of your experience using this resource with students.
All Resources From:
![None]() A1 U5
A1 U5Quadratic Functions
Hoisting the Flag 1

Resource:
Hoisting the Flag 1
Students are given a situation about a flag being raised and several graphs. They have to explain why each graph might work and what is going on to model the situation.

Teacher Feedback
Please comment below with questions, feedback, suggestions, or descriptions of your experience using this resource with students.
All Resources From:
Interpreting graphs modelling different aspects of weather in a region

Resource:
Interpreting graphs modelling different aspects of weather in a region
Interpret and compare graphs of: temperature (in degrees Fahrenheit), solar radiation (in watts per square meters), and cumulative rainfall (in inches)) measured by sensors in Santa Rosa, CA in February 2012.

Teacher Feedback
Please comment below with questions, feedback, suggestions, or descriptions of your experience using this resource with students.
All Resources From:
Matching graphs to situations

Resource:
Matching graphs to situations
There are 6 containers that are being filled with water at a constant rate, and 9 graphs that represent the height of the water in a container as a function of the volume of water in the container. Students must match the each container to its appropriate graph.

Teacher Feedback
Please comment below with questions, feedback, suggestions, or descriptions of your experience using this resource with students.
All Resources From:
Reverse Taboo Trios

Resource:
Reverse Taboo Trios
Students work in groups of 3 to: describe a graph, draw the graph they hear, and record the oral description(s) of the graphs. This will lead to discussions about academic vocanulary regarding graphs and can serve as a pre-assessment as well.

Teacher Feedback
Please comment below with questions, feedback, suggestions, or descriptions of your experience using this resource with students.
All Resources From:
Six Flags End-of-year Algebra Trip Packet

Resource:
Six Flags End-of-year Algebra Trip Packet
This folder has a cover pages and six extended, scaffolded problems that are designed for an end-of-year trip to Six Flags Great America. It covers linear and quadratic functions and transformations. The problems refer specifically to the rides and experiences that students will have while at the park, while at the same time most of the problems can be finished at home or on the bus. Each problem has a rubric for standard-based scoring of problems. Feel free to download and change at will. Please don't change the originals.

Teacher Feedback
Please comment below with questions, feedback, suggestions, or descriptions of your experience using this resource with students.