- NV Math Team
- Getting Started
- Algebra I Archive
- 1: Curriculum Components
- 2: Instructional Routines
- 2A: Contemplate then Calculate
- 2B: Connecting Representations
- 2C: Group Learning Routines
- 2D: Additional Instructional Routines
- 3: ELL and SpEd Student Support
- A1 U0: Introduction to Algebra I
- A1 U1: Modeling with Functions
- A1 U2: Linear and Exponential Functions
- A1 U3: Linear Equations and Inequalities in One Variable
- A1 U4: Linear Equations and Inequalities in Two Variables
- A1 U5: Quadratic Functions
- A1 U6: Quadratic Equations
- A1 U7: Statistics
- Geometry & Algebra II Archive
- Geo U0: Introduction to Geometry
- Geo U1: Tools of Geometry
- Geo U2: Proofs about Congruence
- Geo U3: Similarity and Proof
- Geo U4: Right Triangle Trigonometry
- Geo U5: Extending to Three Dimensions
- Geo U6: Coordinate Geometry
- Geo U6: Circles
- A2 U0: Introduction to Algebra II
- A2 U1: Families of Functions
- A2 U2: Exponential Functions
- A2 U3: Trigonometric Functions
- A2 U4: Rational and Polynomial Functions
- A2 U5: Probability
- A2 U6: Statistics (Inferences from Data)
- Regents Readiness
- Find Resources
Find Resources
Search and browse resources for your classroom.
Use the filters below to see resources for a specific course, unit, and more.
Curriculum:
Filter By:
Type
Standards
- Common Core: Major Standards
- Common Core: Supporting Standards
- Common Core: Additional Standards
- Common Core: Practice Standards
Showing 4 Resources:
Clear Filters
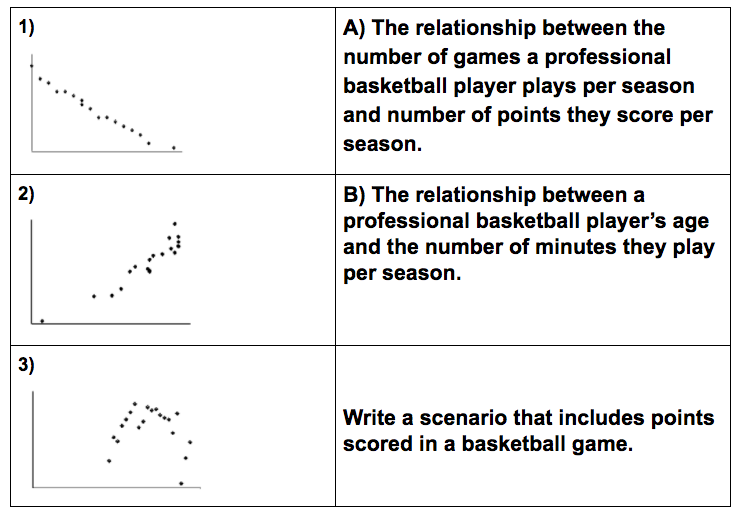
Connecting Situations to Scatter Plots

Resource:
Connecting Situations to Scatter Plots
As an introduction to bivariate data analysis and scatter plots, students make sense of points on the graph. Students understand each axis represents one of the variables. Scatter plots are used to represent data and can be helpful in identifying any correlations that may exist.
Teacher Feedback
Please comment below with questions, feedback, suggestions, or descriptions of your experience using this resource with students.
All Resources From:
![None]() A1 U7
A1 U7Statistics
Constructing Models

Resource:
Constructing Models
This partially completed Core Resource supports students in selecting function models based on scatter plots and interpreting the fit of those models to the graphs.

Teacher Feedback
Please comment below with questions, feedback, suggestions, or descriptions of your experience using this resource with students.
All Resources From:
Interpreting Data

Resource:
Interpreting Data
Students spend this week interpreting bivariate data from the same context, analyzing the data both as categorical data and as quantitative data. From this, students can connect two-way frequency charts to purpose and scatter plots to different purposes. Students also deep dive into both of these representation types in other contexts.

Teacher Feedback
Please comment below with questions, feedback, suggestions, or descriptions of your experience using this resource with students.
All Resources From:
![None]() A1 U7
A1 U7Statistics
Six Flags End-of-year Algebra Trip Packet

Resource:
Six Flags End-of-year Algebra Trip Packet
This folder has a cover pages and six extended, scaffolded problems that are designed for an end-of-year trip to Six Flags Great America. It covers linear and quadratic functions and transformations. The problems refer specifically to the rides and experiences that students will have while at the park, while at the same time most of the problems can be finished at home or on the bus. Each problem has a rubric for standard-based scoring of problems. Feel free to download and change at will. Please don't change the originals.

Teacher Feedback
Please comment below with questions, feedback, suggestions, or descriptions of your experience using this resource with students.