- NV Math Team
- Getting Started
- Algebra I Archive
- 1: Curriculum Components
- 2: Instructional Routines
- 2A: Contemplate then Calculate
- 2B: Connecting Representations
- 2C: Group Learning Routines
- 2D: Additional Instructional Routines
- 3: ELL and SpEd Student Support
- A1 U0: Introduction to Algebra I
- A1 U1: Modeling with Functions
- A1 U2: Linear and Exponential Functions
- A1 U3: Linear Equations and Inequalities in One Variable
- A1 U4: Linear Equations and Inequalities in Two Variables
- A1 U5: Quadratic Functions
- A1 U6: Quadratic Equations
- A1 U7: Statistics
- Geometry & Algebra II Archive
- Geo U0: Introduction to Geometry
- Geo U1: Tools of Geometry
- Geo U2: Proofs about Congruence
- Geo U3: Similarity and Proof
- Geo U4: Right Triangle Trigonometry
- Geo U5: Extending to Three Dimensions
- Geo U6: Coordinate Geometry
- Geo U6: Circles
- A2 U0: Introduction to Algebra II
- A2 U1: Families of Functions
- A2 U2: Exponential Functions
- A2 U3: Trigonometric Functions
- A2 U4: Rational and Polynomial Functions
- A2 U5: Probability
- A2 U6: Statistics (Inferences from Data)
- Regents Readiness
- Find Resources
Find Resources
Search and browse resources for your classroom.
Use the filters below to see resources for a specific course, unit, and more.
Curriculum:
Filter By:
Type
Standards
- Common Core: Major Standards
- Common Core: Supporting Standards
- Common Core: Additional Standards
- Common Core: Practice Standards
Showing 14 Resources:
Clear Filters
Calculating Pi

Resource:
Calculating Pi
The goal of this lesson is to activate students’ current understanding of statistical sampling methods to find an accurate count of a number of dots in an image and then use the results of their sampling to find the value of π. The focus for this lesson should be on the different sampling methods, not the calculation of π.

Teacher Feedback
Please comment below with questions, feedback, suggestions, or descriptions of your experience using this resource with students.
All Resources From:
Constructing Models

Resource:
Constructing Models
This partially completed Core Resource supports students in selecting function models based on scatter plots and interpreting the fit of those models to the graphs.

Teacher Feedback
Please comment below with questions, feedback, suggestions, or descriptions of your experience using this resource with students.
All Resources From:
Decaying Dice

Resource:
Decaying Dice
This Illustrative Mathematics resource draws a very nice set of connections between functions, regression, distributions, probability, and statistics. It can also be used as a formative assessment resource to see how well students understand the ideas from Unit 5 in Algebra II.

Teacher Feedback
Please comment below with questions, feedback, suggestions, or descriptions of your experience using this resource with students.
All Resources From:
End of Unit Assessment (Algebra II, Unit 6)
Geometry & Algebra II Archive
A2 U6: Statistics (Inferences from Data)
Resource:
End of Unit Assessment (Algebra II, Unit 6)
After this unit, how prepared are your students for the end-of-course Regents examination? The end of unit assessment is designed to surface how students understand the mathematics in the unit. It includes spiralled multiple choice and constructed response questions, comparable to those on the end-of-course Regents examination. A rich task, that allows for multiple entry points and authentic assessment of student learning, may be available for some units and can be included as part of the end of unit assessment. All elements of the end of unit assessment are aligned to the NYS Mathematics Learning Standards and PARCC Model Frameworks prioritization.
Teacher Feedback
Please comment below with questions, feedback, suggestions, or descriptions of your experience using this resource with students.
All Resources From:
Instructions for Animals
Geometry & Algebra II Archive
A2 U6: Statistics (Inferences from Data)
Resource:
Instructions for Animals
This page contains instructions on how to use the initial task, Animals, to find out what your students already know about finding the median, mode and range of a set of tabulated data, and interpreting graphs.
Teacher Feedback
Please comment below with questions, feedback, suggestions, or descriptions of your experience using this resource with students.
All Resources From:
Muddying the Waters (Algebra II)

Resource:
Muddying the Waters (Algebra II)
A Classroom Challenge (aka formative assessment lesson) is a classroom-ready lesson that supports formative assessment. The lesson’s approach first allows students to demonstrate their prior understandings and abilities in employing the mathematical practices, and then involves students in resolving their own difficulties and misconceptions through structured discussion.

Teacher Feedback
Please comment below with questions, feedback, suggestions, or descriptions of your experience using this resource with students.
All Resources From:
Normal Distribution Curves

Resource:
Normal Distribution Curves
Students will use the mean and standard deviation of a data set to fit it to a normal distribution thereby getting a better understanding of the structure of graphs and the areas highlighted for Normal Distribution Curves.

Teacher Feedback
Please comment below with questions, feedback, suggestions, or descriptions of your experience using this resource with students.
All Resources From:
Scattered Functions

Resource:
Scattered Functions
Use the visual relationship between a set of dots on a scatter plot to connect the plots to given function families.

Teacher Feedback
Please comment below with questions, feedback, suggestions, or descriptions of your experience using this resource with students.
All Resources From:
Spread of Data #1

Resource:
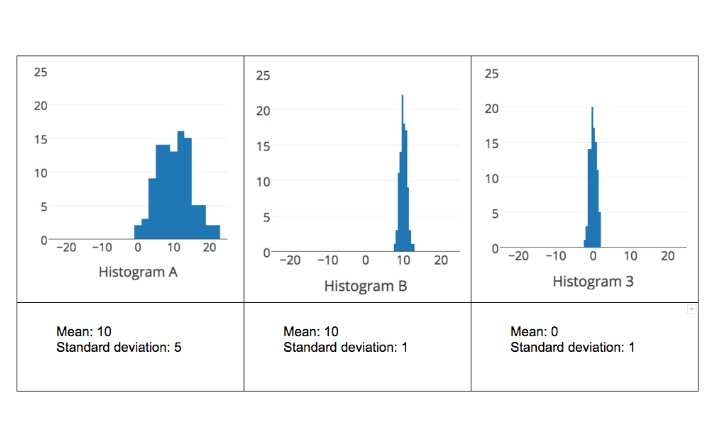
Spread of Data #1
Use the structure of a set of three frequency histograms to make connections between these histograms and the mean & standard deviation of a data set.
Teacher Feedback
Please comment below with questions, feedback, suggestions, or descriptions of your experience using this resource with students.
All Resources From:
Spread of Data #2

Resource:
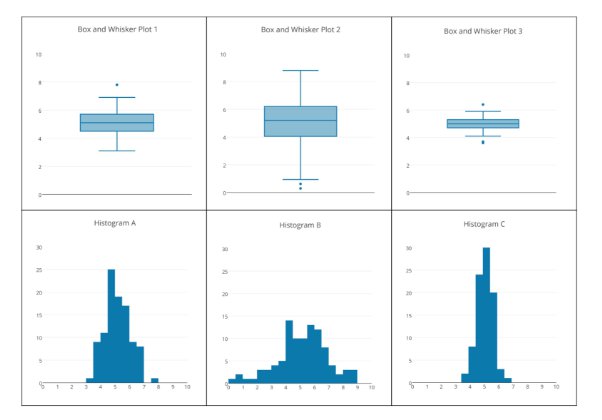
Spread of Data #2
Connect a box and whisker plot to a histogram by using the structure of the spread of data.
Teacher Feedback
Please comment below with questions, feedback, suggestions, or descriptions of your experience using this resource with students.
All Resources From:
Statistics resources

Resource:
Statistics resources
This is a collection of activities and tasks from the Mathematics Visions project.

Teacher Feedback
Please comment below with questions, feedback, suggestions, or descriptions of your experience using this resource with students.
All Resources From:
Studying Samples

Resource:
Studying Samples
Connect what students know about reading and creating frequency distributions, calculating mean and standard deviation for a set of data, and calculating probabilities of events occurring to determine if a sample and control group are statistically significantly different.
This Core Resource does not yet emphasis the distinction between joint, marginal, and conditional relative frequencies.

Teacher Feedback
Please comment below with questions, feedback, suggestions, or descriptions of your experience using this resource with students.
All Resources From: